
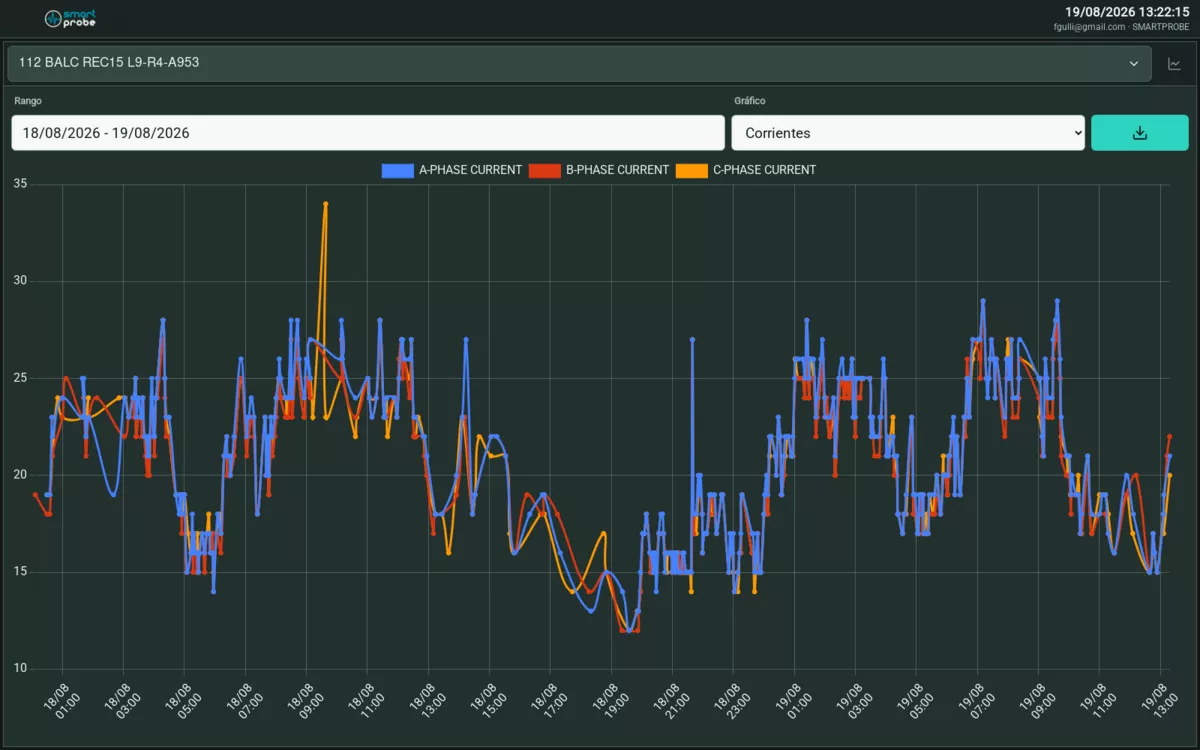
 Historical chart of an analog magnitude.
Choosing what to chart
The device is already selected from the search box above the panel. Inside the Charts view, a dropdown lets you choose the magnitude to plot (for example, current or voltage) — the available options depend on what that particular device measures.
Date range and export
Works the same as in Events and history: a calendar button to pick the range, and the download icon to export the chart to CSV.